An update from the Tamar Toll Action Group.
Some of our supporters may have seen, heard or read us quoting some numbers for costs to various areas in recent days. Either as part of our questioning to the Joint Committee, in the press, or on our various social media outlets.
Data Set:
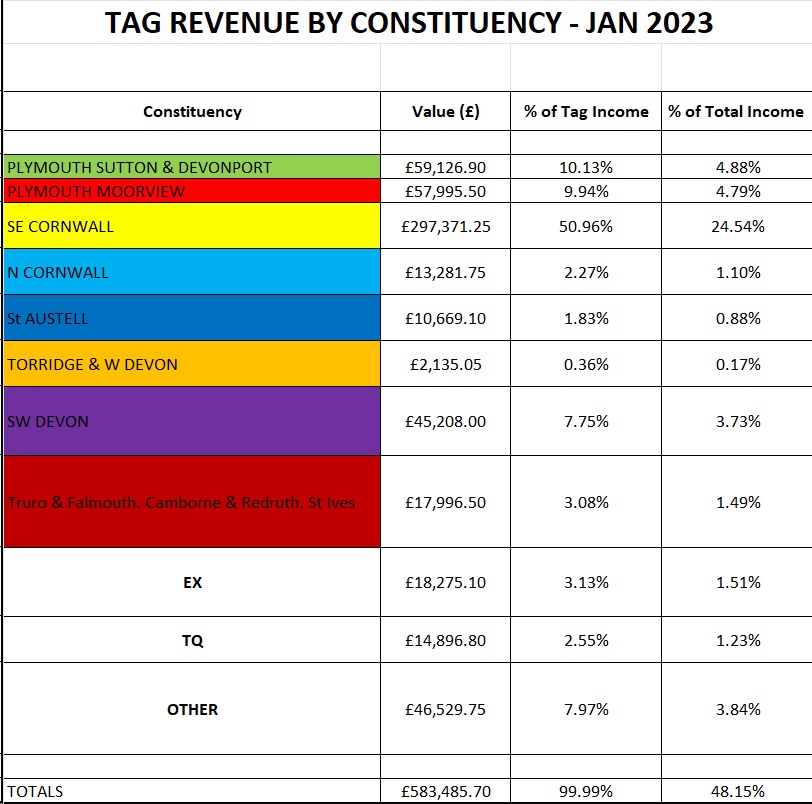
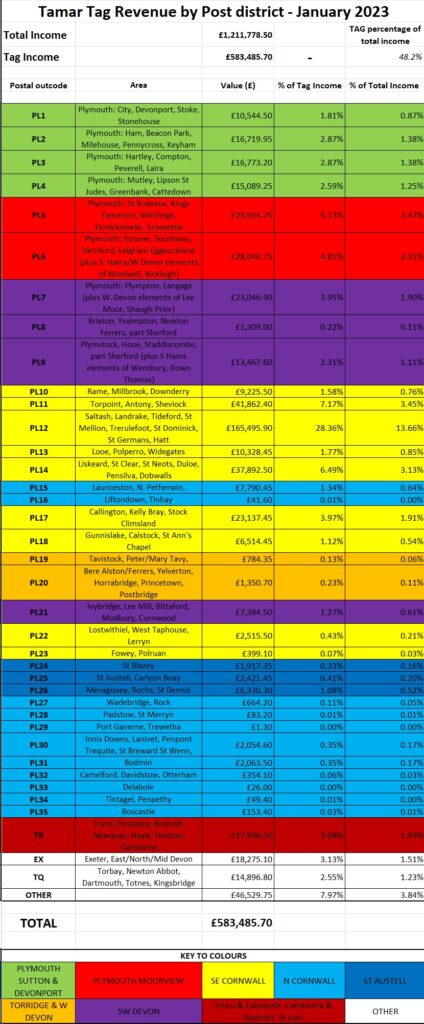
The data in support of these numbers is attached here, it is created from data spreadsheets we received from the Tamar Crossings via the Joint Committee recently. Between them they show details of total costs to TAG account holders across the counties of Devon and Cornwall (and a few further afield) for the month of January 2023. One document shows figures by postal district, the other by constituency. We hope to receive data for the full year in due course. Extrapolate these figures out to an annual basis and it equates to millions being drained from the local economies of Plymouth and South East Cornwall. Remember also, these are just the Tag Account figures.
Brief Analysis:
By Constituency:
From this information it is very clear that the majority of the financial burden falls on South East Cornwall at £297,000 for a single month (51% of TAG revenue raised). By comparison. the two main constituencies of Plymouth funding £117,000 (20% of total TAG revenue raised) which though still a substantial amount in itself, is less than 40% of the total paid by South East Cornwall. Assessed as percentages of the total revenue raised by the crossings, you can see that South East Cornwall’s TAG account holders fund nearly 25% of total revenue, Plymouth TAG account holders just under 10% of total revenue.
By Postal District:
The issue is similar when you look at the costs to postal districts with PL11 (
Torpoint area), PL12 (
Saltash area) and PL14 (
Liskeard area) paying far higher costs than anywhere else. PL12 paying a staggering £165,000 in a single month.
Summary:
This information lays bare the cost to individual communities around the South West and shows where it hits hardest and is having the greatest effect on the local economy there. Also, it details the funds drawn from struggling families and businesses who live there and need to find these amounts in parallel to all the other costs they face in their daily working lives.
The next time you’re told that the toll is “only £1.30 so not that big a deal” by a family member, friend, politician (as we have been by one prominent south west MP) or local Councillor, point them at this information and tell them they’re wrong. Ask them to step up and support the fight to end this injustice and add their voice to the growing demand for change to the way the crossings are funded.
Further Information:
PDF documents with this data can be downloaded from these links:


Thanks for the update, SE Cornwall paying its way!!
I do remember back in the 60s we were informed that once the building costs were recovered the bridge would be adopted into the road system by the Government of the day.
We’d love more details on that if you have them John. To date we have not uncovered any corroborating evidence as to who made that commitment.
They retain the tolls to primarily pay for the ferries. Without the bridge the ferry charge would be huge.
One thought is the number of personnel involved in collecting the tolls. This is a huge cost. Surely anpr could be used instead. This would reduce costs dramatically. Unfortunately the ferries would still have to be manned for H & S but on a reduced basis. Better still, build an alternative for Torpoint.